Manager of Managers
StreetWatch
Our Solutions
Network
Monitoring


Introduction
StreetWatch simplifies and automates IT alert management, notification and event correlation for organisations by consolidating alerts into a single dashboard. StreetWatch is able to ingest data from multiple network monitoring tools, databases, enterprise tools, log servers, and other data points and display them in a normalized format.
IT teams are able to visualize alerts and its impact to the organization with several options, such as; by data points or tools, by alert category, by location, by critical systems, by applications, by network, etc. In the example below, StreetWatch displays alerts by network monitoring tool, OP Manager (1st image) which relates to the critical system, ALLTEL (2nd image).

Image 1

Image 2
Features
Simplifies Alert Management

StreetWatch simplifies alert management in providing users to select alerts that are important and by normalizing the alert category. The ITOM team is provided with two decisions to categorise alerts, WARNING or CRITICAL.
Alert Normalization
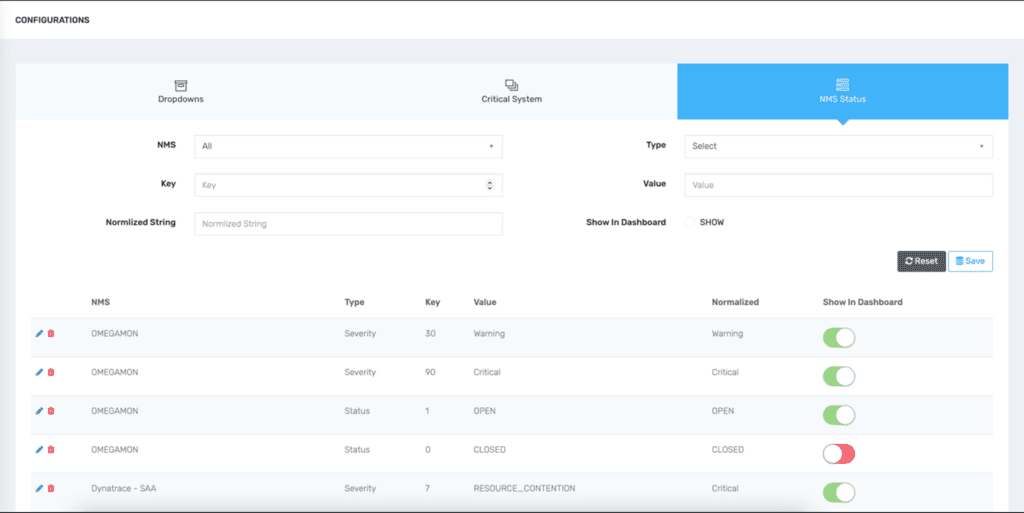
Different monitoring tools generate various type of alerts. Some alerts are meant as information, warning in multiple levels or stages, important and critical. Receiving such alerts can be overwhelming and often leads to missing critical information that requires immediate action. With the alert normalization panel, organizations can determine which alerts are categorised as WARNING and CRITICAL. This strategy gives organizations absolute control to determine meaningful alerts, and by this design, it automatically drowns out the unnecessary alerts generated by various monitoring tools and data points as those not categorised, can be switched off from being displayed on the dashboard.
Automated Alert Escalation


Escalation workflow is essential to any organization to ensure that service level agreements are adhered to. It provides an avenue for organizations to assign alerts based on alert category and alert severity. These alerts can be delivered using the default platform (email and SMS) and social channels (WhatsApp, Telegram, Ms Teams, etc).
Critical System Definition Tool
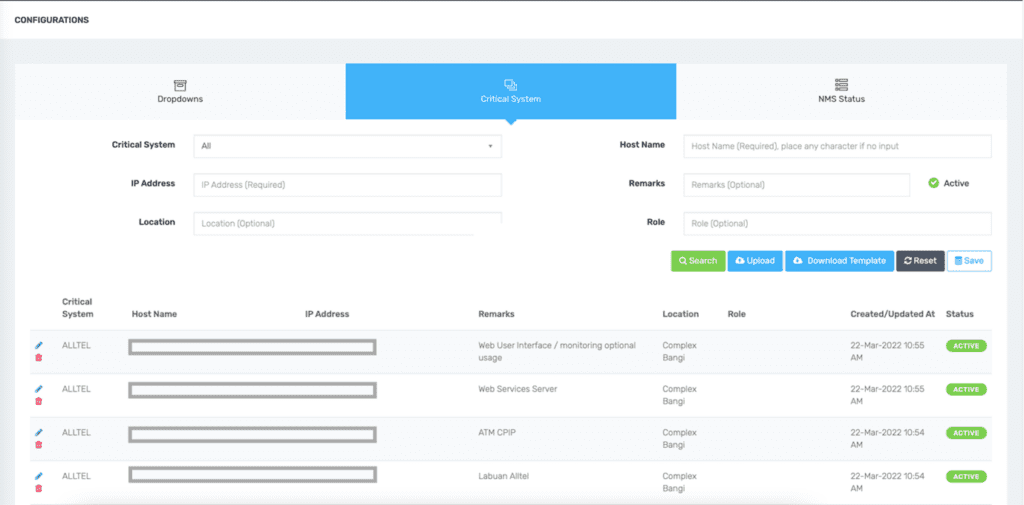
Define critical systems and the eco-system supporting it. This will help organizations keep track if a particular critical system is at risk based on alerts received in StreetWatch.
Authentication and Audit Logs
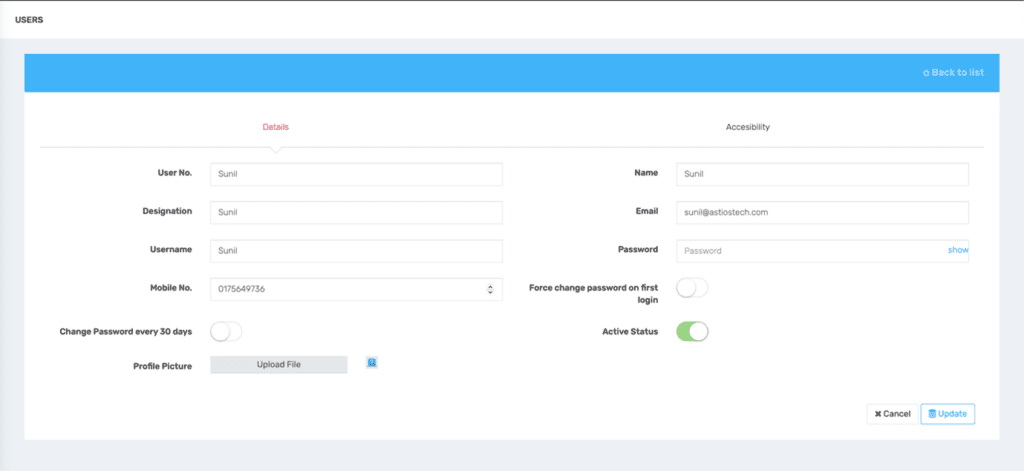
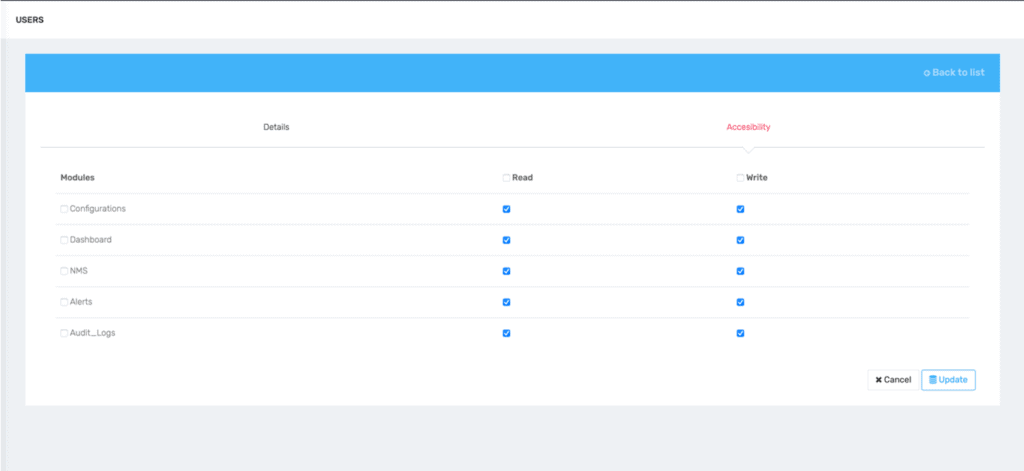
Define critical systems and the eco-system supporting it. This will help organizations keep track if a particular critical system is at risk based on alerts received in StreetWatch.
Search and Filter

Search and filter is available in all areas where detailed alerts are seen, giving users fast and easy access to obtain information. Filter based on host, alert type, critical system, source of alert, location, date, severity, etc.
Dependency Mapping Tool
Some monitoring tools provide dependency information and some don’t. Taking that into consideration, StreetWatch comes with the dependency mapping tool that enables organizations to map critical systems, including applications, network devices, hardware resources, operating system and related business critical eco-system. Immediately get notified if an alert has the potential of disrupting business.
Multi-Functional Dashboard
Assign dashboards based on roles and responsibility. While the ITOM team sees technical details, the CxO in an organization is given access to visually see critical systems that has business impact, without the technical nitty-gritty.
Reporting
Generate reports directly from the dashboard. Export into csv file format to create customized graphs to suit any reporting requirements.
List of available integration
ITSM tools


V-Tiger
Suite CRM

HP-ITSM

Service Desk

ManageEngine Service Desk Plus

JIRA

FreshDesk

Solarwinds Service Desk

eG Enterprise
Network Monitoring Systems


Nagios XI

Solarwinds

Omegamon (IBM)

Dynatrace

HPoV

OpManager

Ms SCOM

Zabbix

Icinga

PRTG

IBM APM
Enterprise Tools


HP 3PAR

Oracle Manager

V Center

Splunk

vROps

Dell EMC

Brocade SANnav
Logs

Any type of log files
